
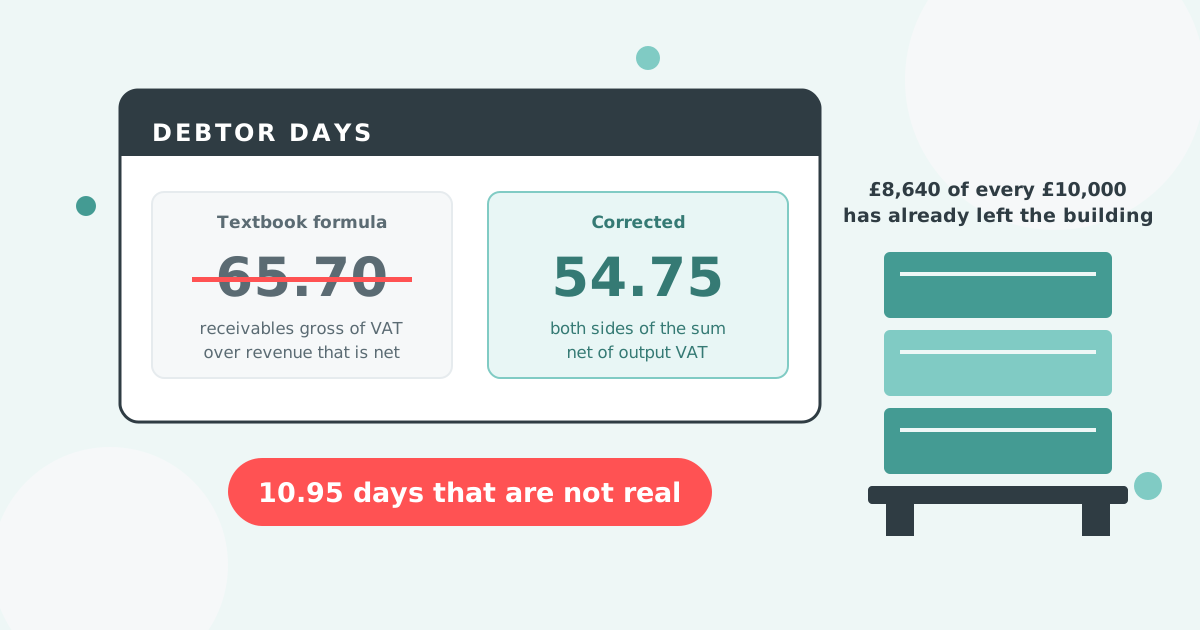

Debtor days is trade receivables divided by credit sales for the period, times the days in the period: £1,800,000 of receivables over £10m of annual credit sales gives 65.70 days. For a UK wholesaler that overstates it by about 20% at the standard VAT rate, because receivables include output VAT and revenue does not; corrected, the figure is 54.75 days.
Debtor days = (trade receivables ÷ credit sales for the period) × days in the period. A wholesaler with £1,800,000 on the aged receivables report and £10,000,000 of annual credit sales has 1,800,000 ÷ 10,000,000 × 365 = 65.70 debtor days. For a year-on-year ratio, average the opening and closing receivables balances first.
In a UK VAT-registered business the two inputs are measured on different bases, so that raw division is wrong before you start. A wholesaler is also more exposed than most, because the cash in an unpaid invoice is mostly not profit: it is money already paid to suppliers for goods that have left the building.
Invoice a trade customer £10,000 of standard-rated goods and they owe you £12,000, because VAT Notice 700 requires the tax to be charged and shown on the invoice as part of the total payable. Your sales ledger carries £12,000. Your profit and loss records £10,000, because the £2,000 is output tax owed to HMRC, not income.
Put the ledger balance over the revenue line and the numerator is 20% larger than the basis of the denominator. The answer comes out 20% high, every month, for every VAT-registered UK business using the standard formula.
The second error is worse, because it is invisible. Every version of the formula in circulation asks for "total credit sales", and no line of that name exists in Xero or QuickBooks Online. So people take total income, which includes counter takings and card sales that never enter receivables.
Those two errors run in opposite directions and there is no reason they cancel. Take the example below. £1,800,000 of receivables over £10.6m of total income, which carries £600,000 of counter sales, gives 62.0 days. Over £10m of net trade sales, 65.70. The right answer is 54.75.
Wholesale carries the stock cost before the invoice falls due. Xero Small Business Insights measures the wait for that sector.
| Market | Wholesale Trade | All industries | Gap | Rank, slowest first |
|---|---|---|---|---|
| Australia | 27.6 days | 20.3 days | +7.3 days | 5th of 19 |
Source: Xero Small Business Insights, June 2026. See the full data on the Paidnice accounts receivable statistics dashboard.
The gap against the national average is the cost of the trade account. Compare it against current UK wholesale and retail payment times or, for Australian sites, Australian wholesale trade payment times.
Yes. Days sales outstanding, or DSO, and debtor days are the same calculation: receivables divided by credit sales for the period, times the days in the period. The vocabulary changes with the market, the arithmetic does not.
US and international finance teams say days sales outstanding, or DSO. UK and Australian teams say debtor days, and "AR aging report" is the US name for the aged debtors report.
The VAT problem is UK, Irish and European. There is no US equivalent, because sales tax is not usually invoiced on a B2B wholesale sale carrying a resale certificate. Our guide to the DSO calculation formula covers that version.
In Xero the debtor days numerator is the total on the Aged Receivables Summary, which is gross of VAT, and in QuickBooks Online it is the accounts receivable ageing summary. The denominator is invoiced trade sales from the profit and loss, which is net, and counter sales must come out of it first.
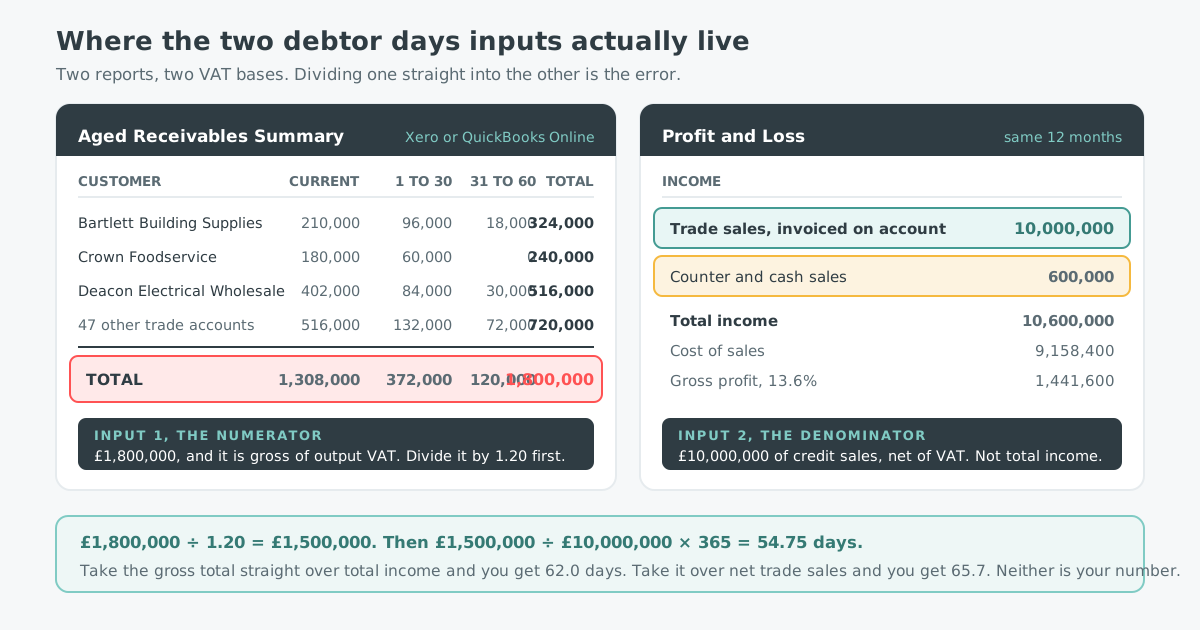
The numerator. In Xero it is the total on the Aged Receivables Summary; in QuickBooks Online, the accounts receivable ageing summary. Both are gross, because that is what the customer owes.
Standard guidance says to average the opening and closing receivables balance, and for a year-on-year ratio that is right: it stops one odd month-end distorting the comparison.
For running a wholesale ledger, take the closing total. Averaging two points twelve months apart flattens the seasonal peak you need to see, and the operating question is what is owed now. Countback handles seasonality properly.
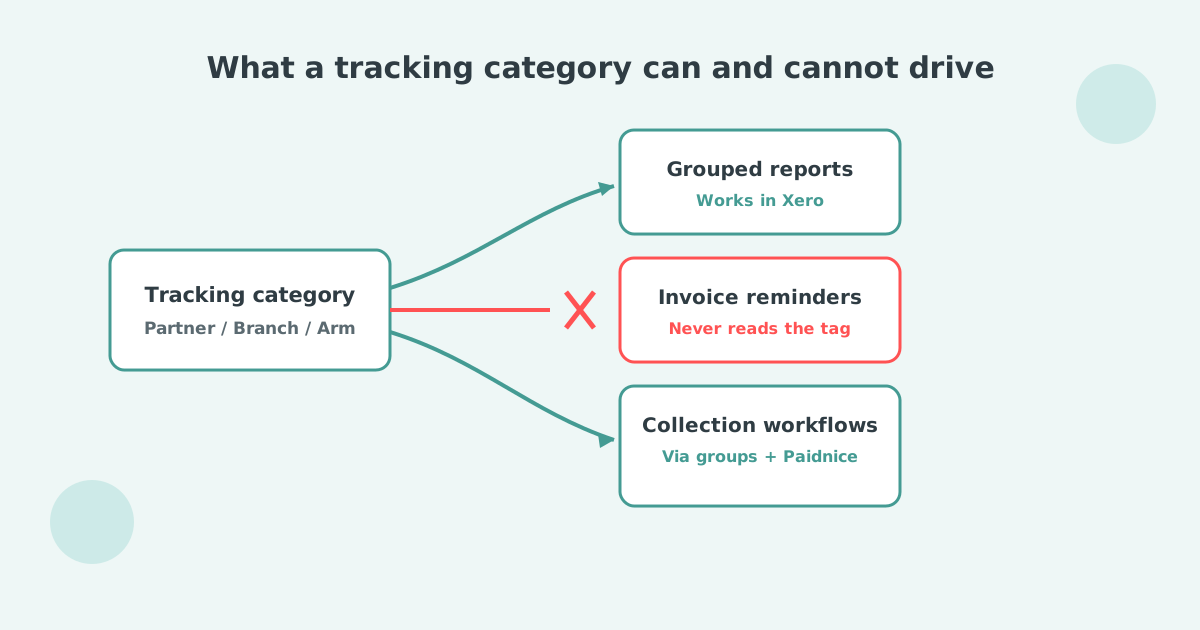
The denominator. Take invoiced trade sales, not total income. If counter or cash sales sit in the same revenue account, split them out: a separate income account or a tracking category fixes the number permanently.
The VAT rate. Do not assume 20%. Divide output VAT charged on sales by net sales for the period, roughly box 1 over box 6 on a UK VAT return. A builders merchant lands near 20%; a food wholesaler selling largely zero-rated grocery lands far below, and over-correcting is as wrong as not correcting.
The most common cause of a debtor days figure nobody trusts is not the formula. It is unallocated cash. A payment banked but never matched against open invoices leaves the ledger showing debt already paid, inflating the number and the ageing together.
Divide the gross receivables balance by one plus your blended output VAT rate, then run the formula. A UK wholesaler with £1,800,000 on the aged receivables report and £10m of net credit sales shows 65.70 textbook debtor days and 54.75 corrected, a gap of 10.95 days.
Cost of money is your rate, not a published figure: overdraft, borrowing margin, or the return you would make on the cash. UK statutory interest for 2026 debts runs at 11.75%. A guide, not financial advice.
A wholesaler turning over £10m of credit sales a year, the ONS average for the division, closes the year with £1,800,000 on the aged receivables report at a blended 20% output VAT rate.
The correction does not get you paid faster. It stops you targeting a number 11 days pessimistic, and stops a VAT rate change reading as an improvement. A standalone version sits on our days sales outstanding calculator.
A good debtor days figure for a wholesaler sits within five days of the effective credit term, which on 30-day end of month following terms means a countback figure around 50.5 days. No trade body publishes a wholesale-specific benchmark in the UK, the US, Australia or New Zealand, so the rows below separate what somebody else published from what I recommend.
| Measure | Figure | Published or recommended | Basis |
|---|---|---|---|
| Median DSO, all US industries | 40.12 days | Published benchmark | CRF national summary of domestic trade receivables, Q1 2026 |
| Best possible DSO | 31.59 days | Published benchmark | CRF, Q1 2026 |
| Average days delinquent | 4.85 days | Published benchmark | CRF, Q1 2026 |
| Collection effectiveness index | 73.48, down from 79.48 | Published benchmark | CRF, Q1 2026 |
| Receivables current | 87.38% | Published benchmark | CRF, Q1 2026 |
| Over 91 days past due | 0.35% | Published benchmark | CRF, Q1 2026 |
| UK large-business average days to pay | 32 days | Published benchmark | DBT payment practices statistics 2025 |
| UK wholesale and retail reporters, days to pay | 37 days, 15% late by number | Published benchmark | DBT, 2025 |
| UK small business average wait | 29.0 days, 8.2 days late | Published benchmark | Xero Small Business Insights, March quarter 2026 |
| Builders merchant receivable days | 50.4 days | Published benchmark, derived from filed accounts | 630.7 ÷ 4,564.6 × 365, Travis Perkins FY2025 |
| Builders merchant bad debt | 0.359% of revenue | Published benchmark, derived from filed accounts | 16.4 ÷ 4,564.6, Travis Perkins FY2025 |
| Countback DSO within 5 days of your effective credit term | 50.5 days on 30-day EOM terms | Recommended target | Mine, from the EOM arithmetic and the Travis Perkins anchor |
| Average days delinquent | 5 days or fewer | Recommended target | Mine, set at the CRF published median |
| Collection effectiveness index | 85% or higher | Recommended target | Mine, above the CRF published median |
| Bad debt | 0.35% of revenue or lower | Recommended target | Mine, anchored on the Travis Perkins actual |
| Statements agreed by working day 5 | 90% or higher | Recommended target | Mine, the highest-yield contact in a statement-traded cadence |
One warning on the target row. On "30 days end of month following" the effective credit period averages 45.5 days and ranges from 31 to 60, set purely by where in the month the customer ordered. A target that does not normalise for that measures order timing, not collections, as the wholesale credit control pillar works through.
Countback DSO consumes the receivables balance backwards through each month's sales, so seasonal trade cannot distort it. Best possible DSO uses only current receivables, average days delinquent is the gap between the two, and the collection effectiveness index measures what share of collectable receivables was collected. Simple debtor days is the number you report; countback is the number you manage by.
Take sales of £900k in June, £1,000k in July and £1,100k in August, with receivables of £1,600k at 31 August, £1,300k of it current. All net of VAT.
Report simple debtor days to the board, manage on countback, and use average days delinquent to separate collections from sales mix. In a seasonal ledger the simple method is wrong in whichever direction the season runs.
Creditor days is the mirror image: trade payables ÷ purchases × days. It carries the same VAT error, because payables are gross of input VAT while purchases are net.
Run both. Creditor days minus debtor days is your funding gap, and in wholesale that gap is mostly cash already paid to a supplier. Pay in 30, collect in 45, and you fund fifteen days of cost of sales on every account.
A settlement discount of 2% for payment in 10 days on 30-day terms costs the seller 37.2% a year, more than three times UK statutory interest, and at a 13.60% gross margin it surrenders 14.7% of the margin to move cash 20 days.
The arithmetic. Annualised cost = [d ÷ (1 − d)] × [365 ÷ (N − D)], where d is the discount, N the net term and D the discount period. For 2/10 net 30: 0.02 ÷ 0.98 = 0.020408, and 365 ÷ (30 − 10) = 18.25, so 0.020408 × 18.25 = 0.3724, or 37.2% a year.
| Structure | Cost to you, per year | What it buys |
|---|---|---|
| 1/10 net 30 | 18.4% | 20 days |
| 2/10 net 30 | 37.2% | 20 days |
| 2.5/10 net 30 | 46.8% | 20 days |
| 2.5/10 on 30-day EOM terms | 26.4% | 35.5 days against the 45.5-day mean |
| 2/10 net 60 | 14.9% | 50 days |
| 5/7 net 30 | 83.5% | 23 days |
Then the margin test. At the ONS 13.60% gross margin proxy, that same 2% surrenders 14.7% of gross margin (2 ÷ 13.6) to move cash 20 days.
Since 1 April 2015, VAT must be accounted for on the amount actually paid, so every discount taken needs a credit note or invoice adjustment: an accounting cost on top of the margin.
The unearned discount is worse here than in per-invoice trading. On one monthly payment covering 200 invoices, a 2% deduction taken without qualifying looks like an unexplained residual and is almost never charged back.
One unpaid £10,000 invoice costs a UK wholesaler £73,529 of replacement sales at the wholesale gross margin proxy of 13.60%, because that is how much new turnover it takes to earn the lost profit back. A 60% margin service business needs £16,667: 4.4 times less work for the same hole.
The ONS Annual Business Survey, released 26 May 2026, records SIC Division 46 turning over £1,018,705m in 2024 across 101,213 enterprises against purchases of £880,158m: a gross margin proxy of 1 − (880,158 ÷ 1,018,705) = 13.60%.
Treat that as a proxy, not a measured margin, and as the thin end of the range. SIC 46.71 fuels drags it down: 36.9% of divisional turnover at a 6.54% proxy. Strip fuels out and the rest of the division proxies at 17.74%.
The reason is what the invoice is made of. At 13.60%, £8,640 of every £10,000 is cash already paid to suppliers for goods now in the customer's warehouse. A cash loss, not a lost opportunity, and it happened at despatch, not at the due date.
So debtor days is a stock and despatch metric with a finance name. Where recovering the goods is still possible, retention of title and deductions covers what your terms must say, and how payment allocation can destroy the claim.
Debtor days falls for three reasons: invoices go out sooner, the collection cadence is consistent, and late payment carries a cost. The first is operations, the other two are automation, and Paidnice runs them on Xero or QuickBooks Online.
Paidnice takes the repeatable parts off a person, and its dashboard shows Days Sales Outstanding, Days Sales Overdue and Average Overdue Age straight from the ledger, with an aged receivables report by contact in 1-30, 31-60, 61-90 and 90+ day buckets:
Customers cut their average wait for payment in half, within 30 days. Pricing is by invoice volume, from £49 / US$69 a month for 150 invoices, Pro from £74 / US$99, no per-seat fees. Statements run from automated customer statements.
The limit, and it matters more in wholesale than anywhere: Paidnice sits on the ledger, not the order book, so it does not block an order at entry. For the comparison, see the best credit control software for wholesalers.
The fastest debtor days improvement we see is rarely a new chase template. It is moving statement day forward and getting the balance agreed early in the month, because a customer who has agreed it cannot hold the payment run.
What is the debtor days formula?
Trade receivables divided by credit sales for the period, multiplied by the number of days in that period. For a UK VAT-registered business, divide the receivables balance by one plus your blended output VAT rate first, so both sides of the sum are net of VAT.
Example: £1,500,000 of net receivables over £10,000,000 of annual credit sales is 1,500,000 ÷ 10,000,000 × 365 = 54.75 days.
Should debtor days include VAT?
No, not on one side only. Your aged receivables report is gross of output VAT and your revenue line is net, so leaving VAT in the numerator overstates debtor days by about 20% at the standard rate. Either strip VAT out of receivables, or gross the sales figure up.
What is a good debtor days figure for a wholesaler?
No UK trade body publishes a wholesale benchmark, so judge against your own effective credit term. On 30-day end-of-month-following terms the true mean term is 45.5 days, so a countback figure around 50.5 is defensible.
Travis Perkins ran 50.4 receivable days in FY2025; the CRF cross-industry median DSO was 40.12 days in Q1 2026.
How do I calculate the number of debtor days for a month?
Take the receivables balance at month end, net of VAT, divide by that month's credit sales, and multiply by the days in the month. For August above: 1,600 ÷ 1,100 × 31 = 45.09 days.
Read it with care. One month is a small denominator, so the figure swings with the sales mix, and any answer longer than the month means receivables span more than one month of trading.
The formula is the easy half. The guide to credit control for wholesalers sets out the order gate, the cadence and the point supply stops.
Paidnice is accounts receivable automation that enforces your payment terms, trusted by thousands of businesses on Xero and QuickBooks. Credit control and debtor management, run for you.
Try it Now - It's FreeNo card required.





Optimize your cash flow with our suite of financial tools designed for AR professionals. Calculate DSO, aging analysis, late fees, and more.